Okteto Insights
This page explains how to scrape the Okteto Insights endpoint and provides an overview of the data available in Okteto Insights
For SaaS or Bring Your Own Cloud (BYOC) customers, Okteto Insights comes pre-configured with Grafana dashboards. Please refer to our Okteto Insights Dashboard Documentation for instructions on accessing and understanding the available metrics. Follow this guide only if you wish to enable another tool to consume Insights data.
Introduction
Okteto inherently generates a lot of data from developers using the platform. This includes product usage and behavior data such as developer usage, as well as infrastructure utilization and performance data like infrastructure and platform activities.
Analyzing this data can be helpful for understanding the performance of your Okteto cluster, including overall health, trends in build and deploy times, and the activity of users on the platform.
How to consume Okteto Insights data
Okteto Insights data is available via API endpoints that can be scraped using tools like Prometheus. This provides a way for Okteto Administrators to obtain and consume this data programmatically. For a quick setup, follow the below steps to turn on Insights and get your bearer token. Then, deploy our open-source Insights Dashboards to get started visualizing your Okteto data.
Enable the Helm Setting
This feature is disabled by default for Self Hosted instances. To enable it you will need to set the helm setting insights.enabled to true and upgrade your Okteto instance.
Once you enable the feature, Okteto will create a new endpoint accessible through https://okteto.SUBDOMAIN/metrics where data will be available in Prometheus format. This new endpoint is protected with a bearer token which is auto-generated by Okteto. Alternatively, you can specify your own token using the secret defined in this helm setting.
Retrieve your Bearer Token
To retrieve your Insights bearer token from the Okteto Admin Dashboard, navigate to Admin -> General under the Integrations section. You can copy your bearer token by clicking on the Show Insights Token button in the Insights panel.
Set up the Dashboards
To begin collecting and visualizing Insights data, use our sample repository. It includes setups for deploying Prometheus and Grafana, along with sample dashboards.
If you'd like to configure this yourself, you'll need to configure a scraper to connect to this endpoint using the proper token. An example of a Prometheus scraper configuration is:
- job_name: "okteto_scrapper"
  scrape_interval: 5m
  scrape_timeout: 30s

  scheme: http
  static_configs:
    - targets: ["okteto.<SUBDOMAIN>:443"] # replace <SUBDOMAIN> with your Okteto subdomain
  authorization:
    type: Bearer
    credentials: <bearer-token> # replace <bearer-token> with the token generated by Okteto
Okteto Self-Hosted does not include a Prometheus instance or storage for this data. You will need to deploy your own Prometheus instance (or another data collection platform) to consume the data and manage counters and metrics using Prometheus’ built-in features
The Open Source Dashboard Repository includes a Prometheus configuration and is a good starting place for configuration.
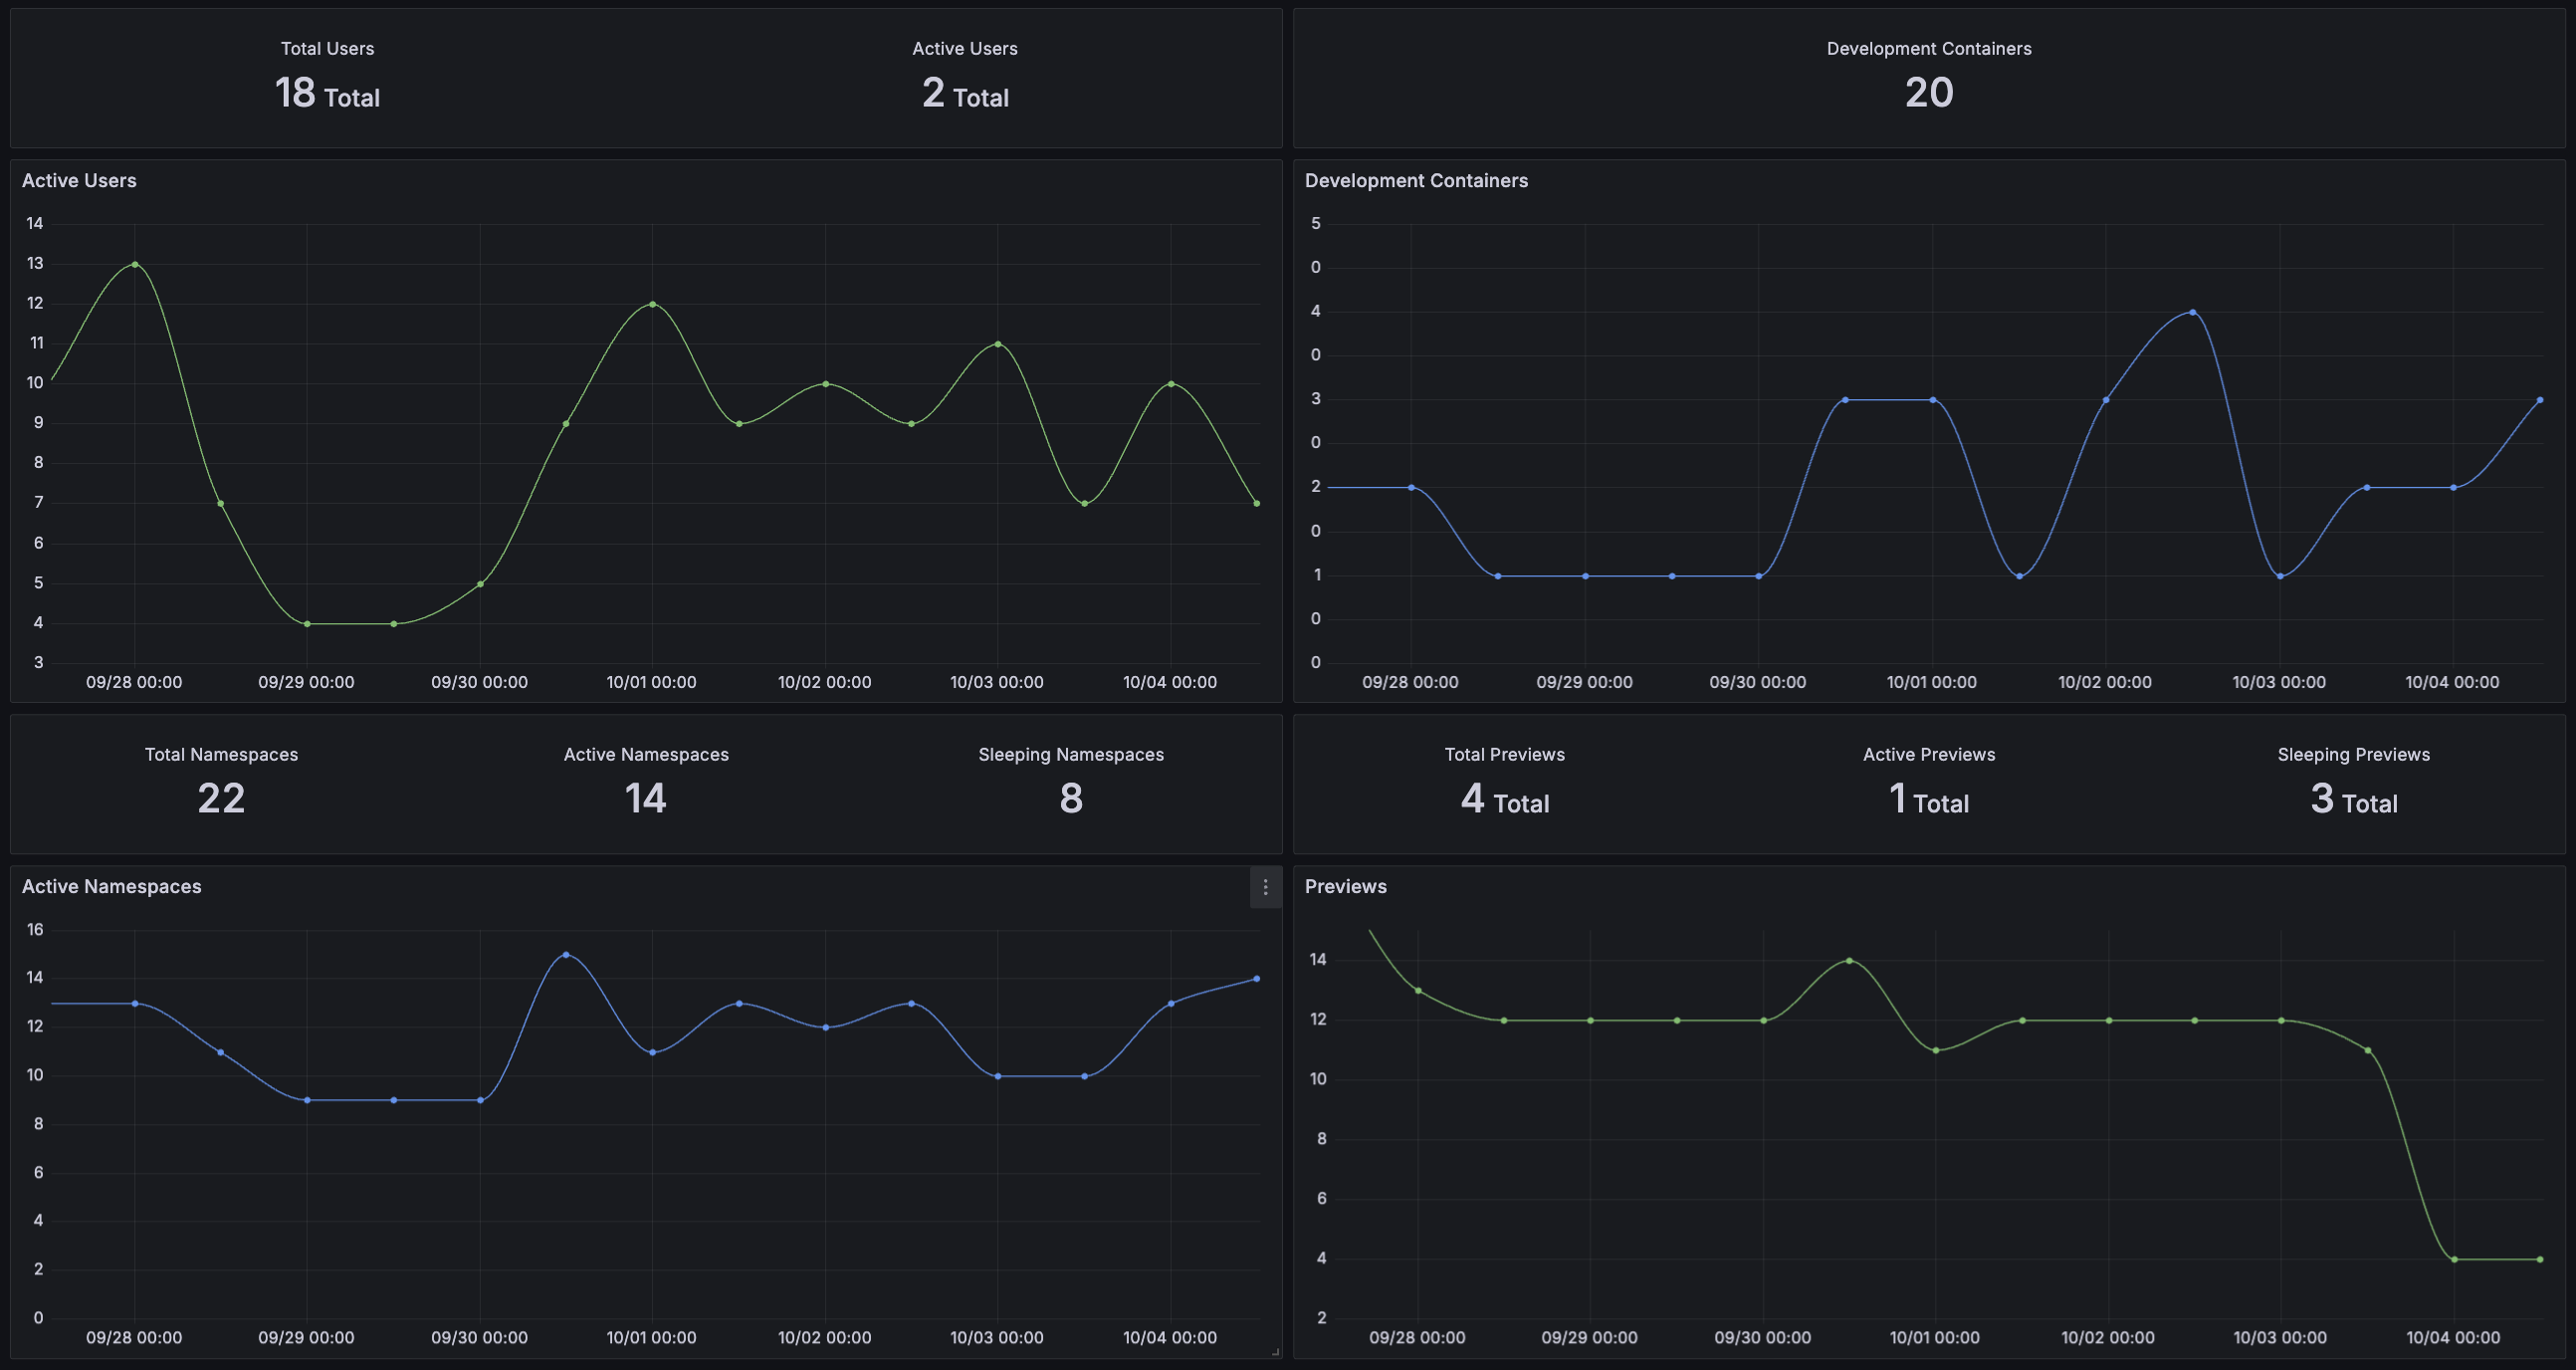
Insights Dashboards
Okteto provides open source Grafana dashboards based on the Insights data made available. These dashboards should enable to you quickly get started using Okteto Insights and serve as a base to build more customized metrics for your organization.
Please refer to our Okteto Insights Dashboard Documentation for instructions on understanding the available metrics.
What data is available
As part of Okteto Insights, we are offering the following metric groupings:
- Build Metrics: Information on Build times and results by environment
- Deploy Metrics: Information on Deploy times and results by environment
- Namespace Metrics: Information on the Sleeping and Awake Namespaces
- Node Metrics: CPU and Memory stats on your Okteto Nodes
- Pod Metrics: CPU and Memory stats on your Okteto Pods
- Preview Metrics: Information on Sleeping and Awake Preview Environments
- Test Metrics: Information on test times and results by environment
- User Metrics: Information on User activity
All metrics provided by Okteto will have the prefix okteto_
Okteto will progressively make more data available through this endpoint. The following metrics are available today:
Build Metrics
Only successful builds are tracked with okteto_usage_build_duration_seconds.
| Metric Name | Type | Description | Labels |
|---|---|---|---|
okteto_usage_build_duration_seconds | histogram | This represents metrics related to build times of the images that are being built within Okteto. This metric only reflects builds that have successfully completed. | devenv_name, image_name, namespace, repository |
okteto_usage_build_result | counter | This represents metrics related to the result of the builds that are being built within Okteto. | devenv_name, image_name, namespace, repository, result |
- Build Metrics label definitions:
devenv_name: If defined, this represents the name of the deployed development environment it is linked toimage_name: Represents the name of the image to be built as it appears in the Okteto Manifestnamespace: Contains the okteto cli context from where the request originatedrepository: Contains the git repository where the okteto manifest that defines this image is hostedresult:success,failureorskippedrepresent the status of the image
Deploy Metrics
Only successful deployments are tracked with okteto_usage_deploy_duration_seconds.
| Metric Name | Type | Description | Labels |
|---|---|---|---|
okteto_usage_deploy_duration_seconds | histogram | This represents metrics related to the time it takes to deploy a development environment. This metric only show deployments that have successfully completed. | devenv_name, namespace, repository, phase |
okteto_usage_deploy_result | counter | This represents metrics related to the result of the deployment of a development environment. | devenv_name, namespace, repository, result |
- Deploy Metrics label definitions:
devenv_name: Represents the name of the deployed development environmentnamespace: Contains the okteto cli context from where the request originatedrepository: Contains the git repository where the okteto manifest that defines this development environment is hostedphase: Represents the phase of the deployment (eithercomposeorcommands) for which the time series is being recorded.composerefers to the Compose section, andcommandsrefers to the Commands section of the Okteto manifest's Deploy section, indicating how long it took to complete. Summing the time series would represent the total length of a Deploy action.result: Can besuccessorfailureto represent the status of the deployment
Namespace Metrics
| Metric Name | Type | Description | Labels |
|---|---|---|---|
okteto_system_namespace_status_condition | gauge | This metric represents the status of a namespace. Preview namespaces are not included here. | namespace, condition, owner_id |
okteto_system_namespace_created_time | gauge | This metric represents the creation time of a namespace. | namespace, owner_id |
- Namespace Metrics label definitions:
namespace: Contains the namespace namecondition: Represents the condition of the namespace, values can beactiveorsleepingowner_id: Represents the owner ID of the namespace
Node Metrics
| Metric Name | Type | Description | Labels |
|---|---|---|---|
okteto_system_node | gauge | This metric represents the number of nodes running Okteto. | none |
okteto_system_node_memory_bytes | gauge | This metric represents the total memory (in bytes) available for allocating to a node. | node_name |
okteto_system_node_memory_requested_bytes | gauge | This metric represents the total memory (in bytes) requested for a node. | node_name |
okteto_system_node_memory_usage_bytes | gauge | This metric represents the total memory (in bytes) in use for a node. | node_name |
okteto_system_node_cpu_cores | gauge | This metric represents the total CPU cores available for allocating to a node. | node_name |
okteto_system_node_cpu_requested_cores | gauge | This metric represents the total CPU cores requested for a node. | node_name |
okteto_system_node_cpu_usage_cores | gauge | This metric represents the total CPU cores in use for a node. | node_name |
- Node Metrics label definitions:
node_name: Contains the name of the node represented
Pod Metrics
| Metric Name | Type | Description | Labels |
|---|---|---|---|
okteto_system_pod_container_cpu_requests_cores | gauge | This metric represents the total CPU requested of a pod and standard container at that point in time. | container_name, pod_name, namespace, node_name, devenv_name, pod_type, controller_type, controller_name |
okteto_system_pod_container_cpu_limits_cores | gauge | This metric represents the CPU limits of a specific pod and standard container at that point in time. | container_name, pod_name, namespace, node_name, devenv_name, pod_type, controller_type, controller_name |
okteto_system_pod_init_container_cpu_requests_cores | gauge | This metric represents the CPU requests of a specific pod and init container at that point in time. | container_name, pod_name, namespace, node_name, devenv_name, pod_type, controller_type, controller_name |
okteto_system_pod_init_container_cpu_limits_cores | gauge | This metric represents the CPU limits of a specific pod and init container at that point in time. | container_name, pod_name, namespace, node_name, devenv_name, pod_type, controller_type, controller_name |
okteto_system_pod_container_cpu_usage_cores | gauge | This metric represents the CPU usage of a specific pod and standard container at that point in time. | container_name, pod_name, namespace, node_name, devenv_name, pod_type, controller_type, controller_name |
okteto_system_pod_container_memory_requests_bytes | gauge | This metric represents the memory requested for a specific pod and standard container at that point in time. | container_name, pod_name, namespace, node_name, devenv_name, pod_type, controller_type, controller_name |
okteto_system_pod_container_memory_limits_bytes | gauge | This metric represents the memory limits for a specific pod and standard container at that point in time. | container_name, pod_name, namespace, node_name, devenv_name, pod_type, controller_type, controller_name |
okteto_system_pod_init_container_memory_requests_bytes | gauge | This metric represents the memory requested for a specific pod and init container at that point in time. | container_name, pod_name, namespace, node_name, devenv_name, pod_type, controller_type, controller_name |
okteto_system_pod_init_container_memory_limits_bytes | gauge | This metric represents the memory limits for a specific pod and init container at that point in time. | container_name, pod_name, namespace, node_name, devenv_name, pod_type, controller_type, controller_name |
okteto_system_pod_container_memory_usage_bytes | gauge | This metric represents the memory usage of a specific pod and standard container at that point in time. | container_name, pod_name, namespace, node_name, devenv_name, pod_type, controller_type, controller_name |
- Pod Metrics label definitions:
container_name: Contains the name of the container being representedpod_name: Contains the name of the pod being representednamespace: Contains the namespace namenode_name: Contains the node namedevenv_name: If defined, this represents the name of the deployed development environment it is linked topod_type: It determines if the pod is in development mode or not, values can bedevelopmentorstandardcontroller_type: Represents the type of the top controller that created the pod, values can bedeploymentorstatefulsetcontroller_name: Contains the name of the top controller that created the pod
Preview Metrics
| Metric Name | Type | Description | Labels |
|---|---|---|---|
okteto_system_preview_status_condition | gauge | This metric represents the status of a preview. | namespace, condition, scope, owner_id |
okteto_system_preview_created_time | gauge | This metric represents the creation time of a preview. | namespace, scope, owner_id |
- Preview Metrics label definitions:
namespace: Contains the namespace namecondition: Represents the condition of the preview, values can beactiveorsleepingscope: Represents the scope of the preview, values can bepersonalorglobalowner_id: Represents the owner ID of the preview
Test Metrics
Only successful tests are tracked with okteto_usage_test_duration_seconds.
| Metric Name | Type | Description | Labels |
|---|---|---|---|
okteto_usage_test_duration_seconds | histogram | This represents metrics related to the time it takes to execute a test container. This metric only show tests that have successfully completed. | devenv_name, namespace, repository, test_name |
okteto_usage_test_result | counter | This represents metrics related to the result of the tests of a development environment. | devenv_name, namespace, repository, test_name, result |
- Test Metrics label definitions:
devenv_name: Represents the name of the development environmentnamespace: Contains the Okteto CLI context from where the request originatedrepository: Contains the git repository where the Okteto manifest that defines this Development Environment is hostedtest_name: Represents the test container being executedresult: Can besuccessorfailureto represent the status of the test container
User Metrics
| Metric Name | Type | Description | Labels |
|---|---|---|---|
okteto_system_user_last_seen_time | gauge | This metric represents the last activity of a user. | id, external_id, role |
- User Metrics label definitions:
id: Contains the user idexternal_id: The external id of the userrole: The role of the user
Troubleshooting and Support
Metric Server Availability
Okteto Insights relies on the Kubernetes Metric Server. If the Metric Server is unavailable, requests to the /metrics endpoint, like requests from a configured scraper, will fail. You can troubleshoot the Metric Server or refer to the documentation for further guidance.