Build Service Management
The Build Service admin view provides comprehensive monitoring for your BuildKit infrastructure.
Overview
The Build Service uses BuildKit, a high-performance image builder, to power fast image builds and remote executions. The admin dashboard provides visibility into BuildKit pod health, resource utilization, and active build workloads.
For more information about optimizing BuildKit performance, see the BuildKit High Performance guide.
Accessing the Build Service Dashboard
Navigate to Admin → Build Service in the Okteto UI to access the Build Service management interface.
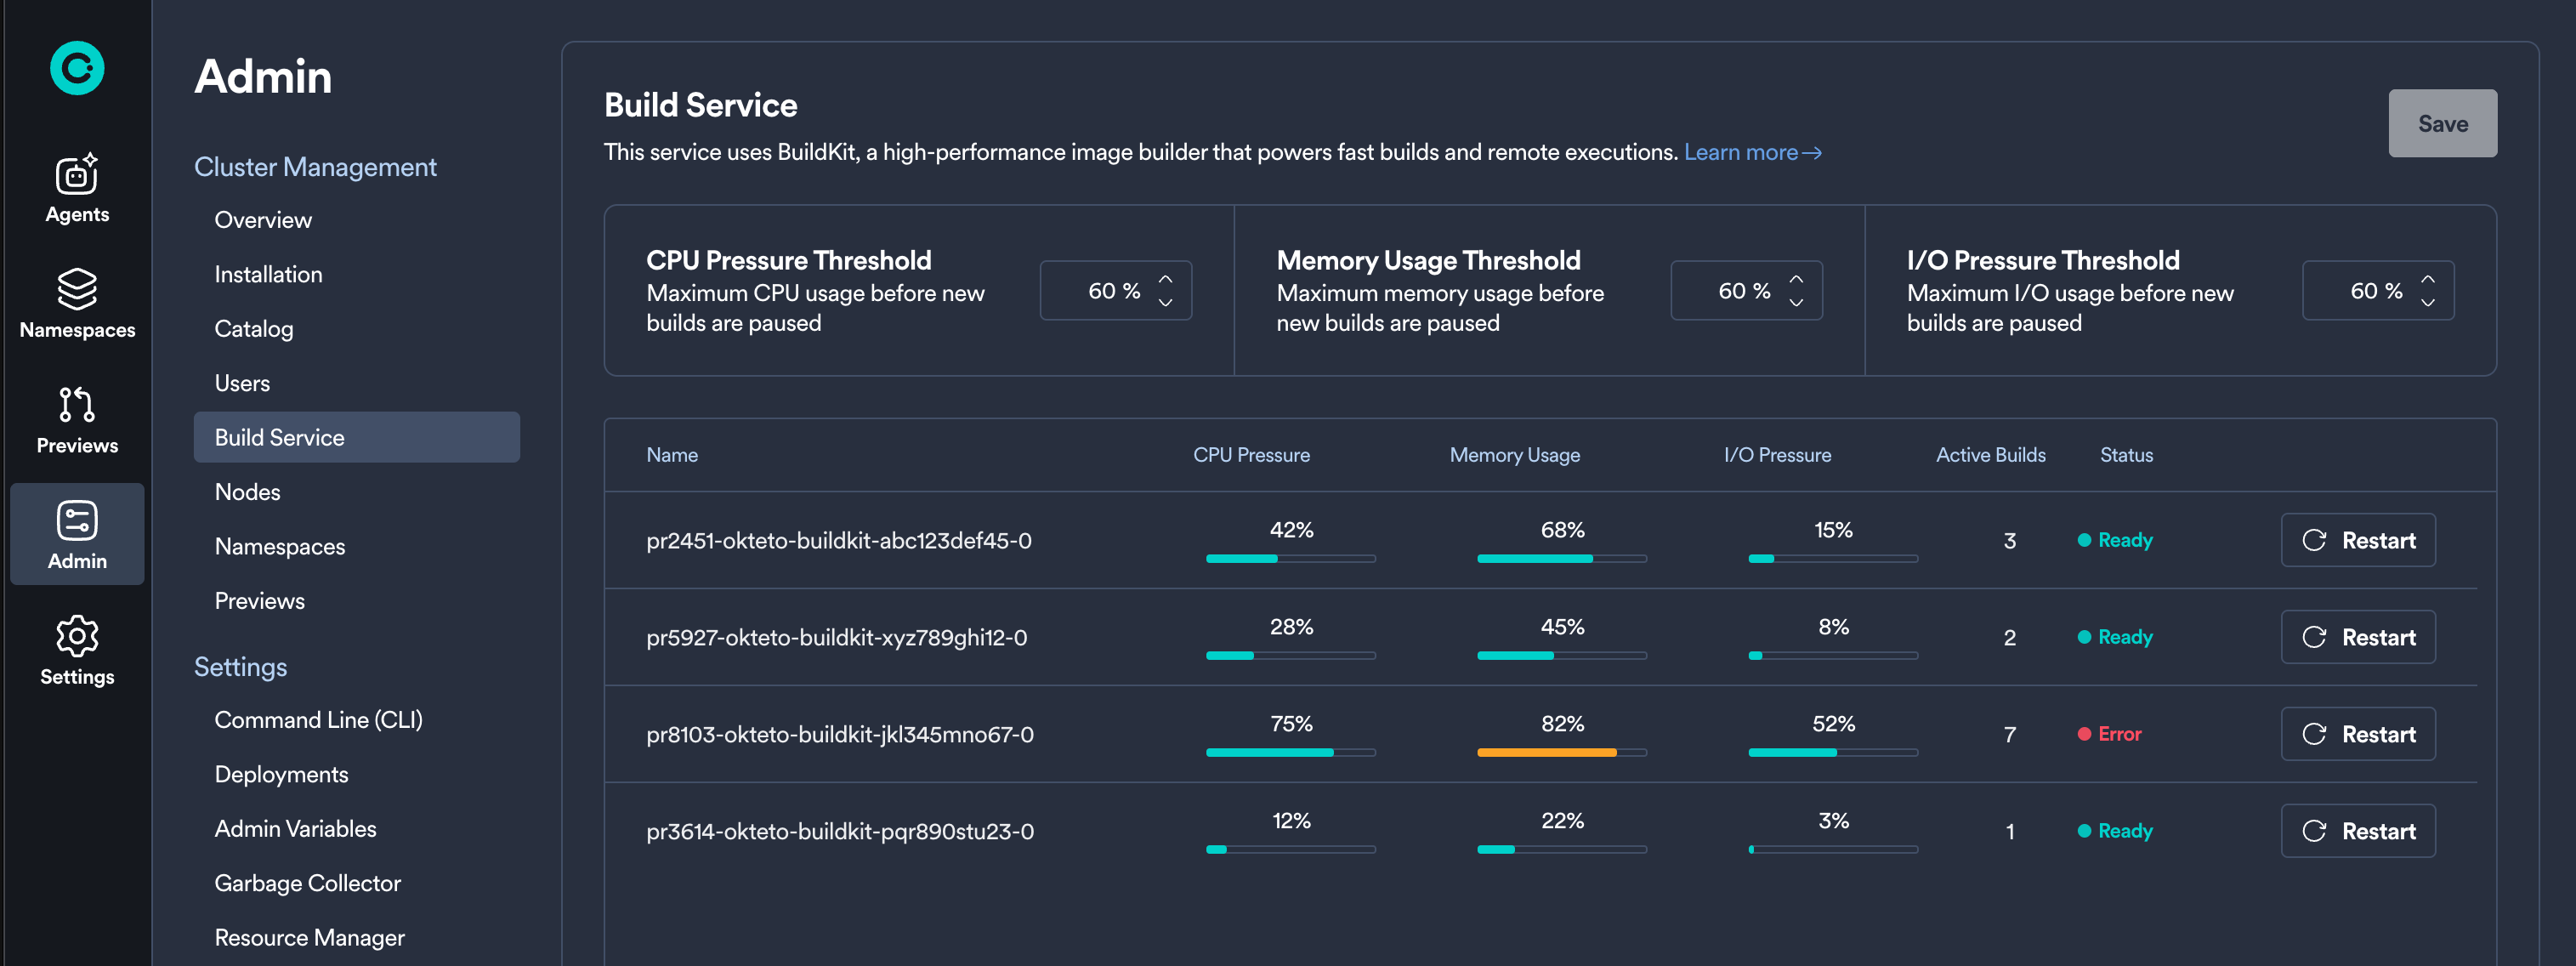
Metrics
The Build Service dashboard displays key metrics for each BuildKit pod:
- CPU Pressure: indicates how much any process is waiting for CPU in the last 10s. A value greater than 50% is a potential signal of build performance degradation.
- Memory Usage: a percentage out of 100%. A value close to 70% increases your chances to face Out-Of-Memory kill events.
- IO Pressure: indicates how much any process is waiting for IO in the last 10s. A value greater than 30% is a potential signal of build performance degradation.
- Active Builds: number of concurrent builds.
Understanding Pod Status
Each BuildKit pod displays one of the following statuses:
- Ready: The pod is healthy and below all recommended thresholds (50% CPU pressure, 70% Memory usage, 30% IO pressure).
- Busy: One or more metrics exceed the recommended thresholds (50% CPU pressure, 70% Memory usage, 30% IO pressure).
- Starting: The pod is initializing and not yet ready to accept builds.
- Stopping: The pod is gracefully terminating, allowing active builds to complete.
- Error: The pod has encountered an error.
Related Documentation
- Build Service Overview - Learn about how the Okteto Build service works
- BuildKit High Performance - Detailed guide on optimizing BuildKit performance at high scale
- BuildKit Helm Configuration - Configure BuildKit settings in your Helm chart